This story takes us back to a time when James Bond was sent undercover as an MI-6 agent to a highly classified school. His mission was to observe the participants closely.

Bond meticulously tracked the grades of all the students and created tables where each row represented a student, and each column represented their scores in specific subjects such as math, sports, and geography. Soon, Bond found himself overwhelmed by a massive amount of data. To simplify it, he decided to calculate the average grade for a certain period, thinking it would provide a more representative picture.

However, the results turned out to be inconclusive. Bond then attempted to calculate the average grades across all students. Since this measure was independent of each student’s individual abilities, it reflected rather the quality of teaching in the school for each subject. In the next step, Bond realized that the individual deviations from this average would be more informative.
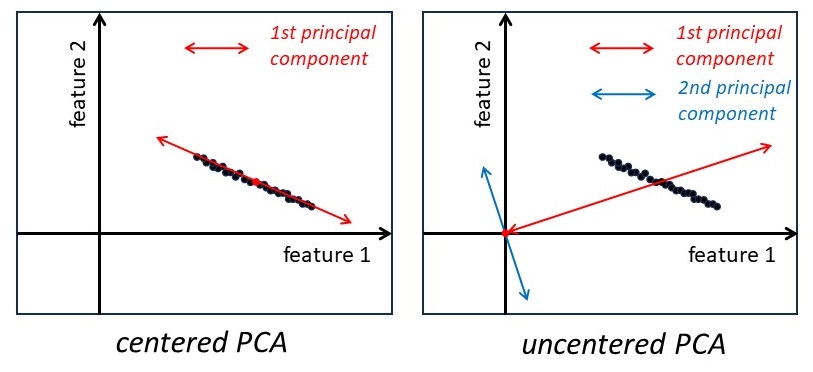
Nevertheless, analyzing the data proved to be challenging. The headquarters advised him to employ some linear algebra techniques, specifically the rotation of basis. You see, the scores in the three subjects can be likened to coordinates in a three-dimensional space, and they can be transformed into a rotated basis.

James experimented with this rotation and made an intriguing discovery. It was possible to rotate the basis in such a way that most of the columns in the transformed table became zero or close to zero. In other words, when the data was projected onto the new y and z coordinates, it resulted in little useful information and mostly represented noise. These y and z columns were deemed unimportant and could be removed.

Now, what about the remaining new x coordinate? James Bond found that it exhibited a distinct pattern: positive numbers for math and negative numbers for sports and geography, in a certain proportion. Aha, thought James, students with positive values in this specific score tended to have analytical thinking skills, while those with negative values were more inclined towards activities such as traveling, acting, and shooting.
Bond now had a powerful tool to characterize the individual profiles of each student, providing crucial results to report back to headquarters.

Technical example
How can we apply James Bond’s experience to our own endeavors? Let’s consider a vast collection of spectra comprising 1000 energy channels, all of which are affected by noise. Behind the scenes, the only variation lies between compound A and compound B, whose ideal spectra are depicted in the figure.

However, the presence of significant noise makes spectra horrible. It is not clear what is going on in the data set:

No panic! Following Bond’s strategy, we calculate the mean spectrum and treat all the data as deviations from this mean. Still, analyzing the data with 1000 channels proves challenging. Go further!
Apply Principal Component Analysis (PCA), which is akin to the rotation technique employed by James Bond. Miraculously, PCA reveals that essentially one parameter varies across the data: the proportion of compounds A and B. To emphasize, instead of dealing with 1000 independent counts across 1000 channels, we find that there is only one parameter that predominantly governs all counts. This parameter is the strength of the deviation from the mean while the shape of deviation is characterized by a certain curve revealed by the PCA basis.

To distance ourselves from spy terminology, let’s refer to this curve as an “eigenvector” rather than a “signature.” This eigenvector shows a trend.
Lets also clarify our usage of the term “trend,” as it deviates from the commonly intuitive definition of collective behavior driven by a specific impulse, such as the buying of Tesla stocks. Instead, we refer to a statistical linear trend, which can be extrapolated in two directions. Following a positive direction signifies the strengthening of a particular feature, while following a negative direction indicates its weakening.
Now, all spectra with a parameter close to +1.0 would exhibit the spectrum of compound A, while those close to -1.0 would display the spectrum of B. Naturally, there are numerous spectra that fall in between A and B, representing a mixture of the two compounds. Their parameter is in the range (-1.0 : +1.0). Our comprehension of the data set has now reached a state of clarity and coherence.

In conclusion, PCA analysis not only enables us to compress and denoise spectroscopic data but also allows us to extract clear variation trends that may go unnoticed to the naked eye. By reducing the complexity of the data and identifying the dominant trends, PCA provides valuable insights and reveals patterns that might otherwise remain hidden.
Leave a Reply